Class 1 Railroads (USA): Revenue, Statistics & Overview
Last revised: August 9, 2026
By: Adam Burns
The history of the Class I railroad traces back to the nation’s first common carrier, the Baltimore & Ohio. Over the next century more than 140 systems wore the designation. After World War II, mergers, bankruptcies, and takeovers reduced the field to today’s six Class I freight railroads recognized by the Association of American Railroads (AAR) for U.S. freight service:
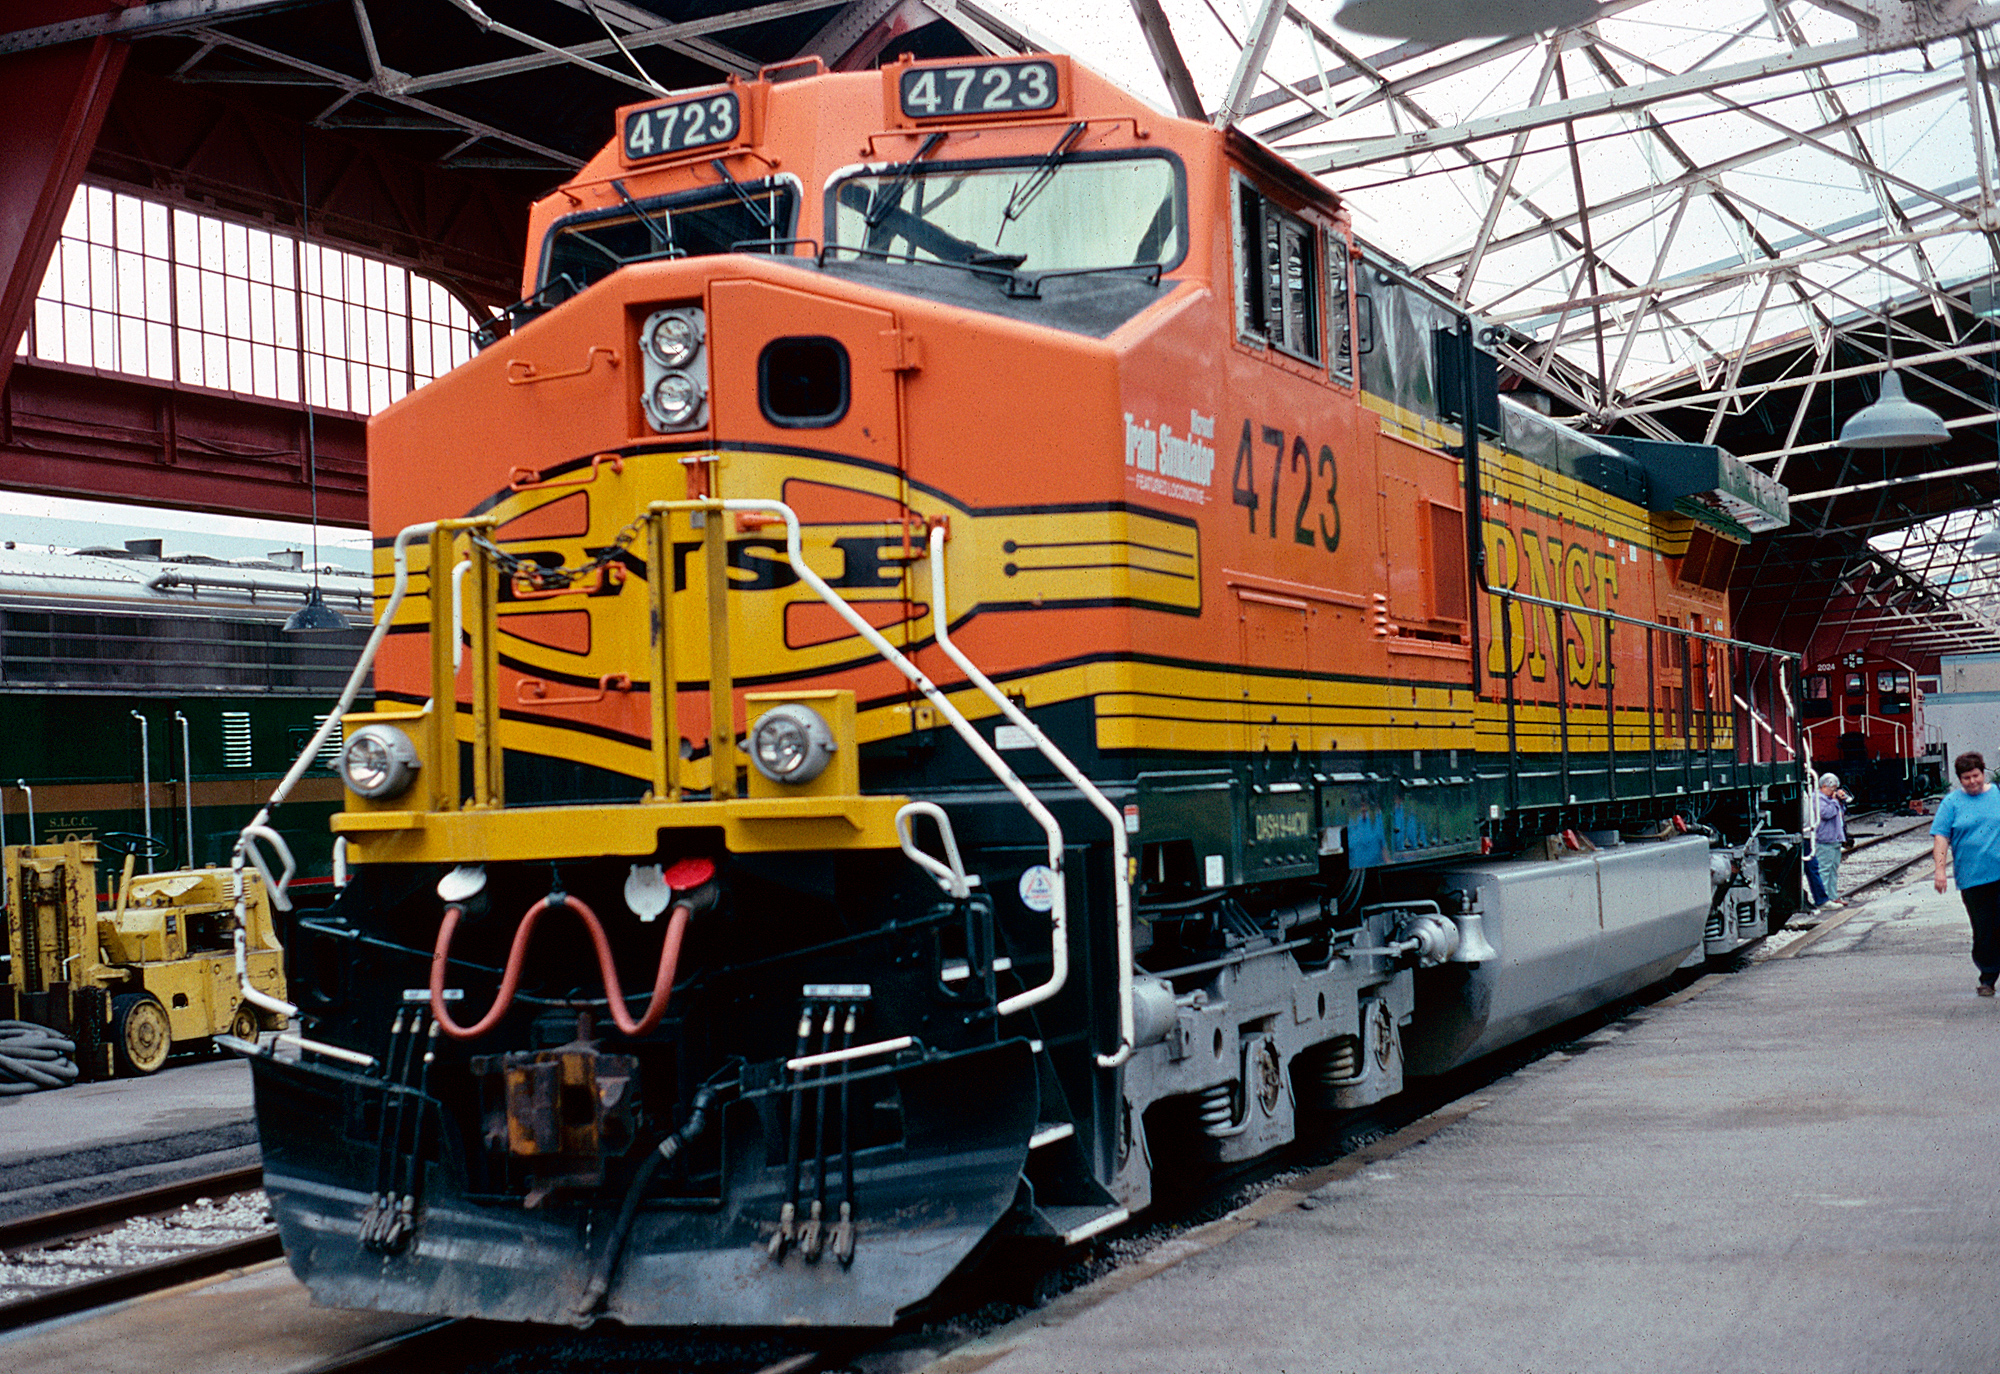
Burlington Northern Santa Fe C44-9W #4723, the official Microsoft Train Simulator locomotive, is seen here on display at St. Louis Union Station in May, 2001. American-Rails.com collection.
- BNSF Railway
- Union Pacific Railroad
- CSX Transportation
- Norfolk Southern Railway
- Canadian National Railway (U.S. operations via Grand Trunk Corporation and related subsidiaries)
- Canadian Pacific Kansas City (CPKC)
These carriers hold the bulk of U.S. freight-rail route miles, employees, and freight revenue. They concentrate on long-haul, high-density intercity traffic—a sharp contrast with the classic era, when railroads also chased local and less-than-carload business. A true single-system Atlantic–Pacific freight railroad remains unrealized; whether that changes depends in part on the pending Union Pacific–Norfolk Southern merger case before the Surface Transportation Board (STB) (see below).
Related industry pages: Regional Railroads · Short Lines · Industry History · Fallen Flags.
At a Glance (2025–2026)
| Item | Detail |
|---|---|
| U.S. Class I freights (AAR count) | Six: BNSF, UP, CSX, NS, CN (U.S.), CPKC |
| STB Class I revenue threshold (2025) | About $1.095 billion in annual operating revenue (inflation-adjusted; see definition below) |
| STB Class II threshold (2025) | About $49.1 million |
| U.S. freight rail network | Nearly 140,000 route miles (all freights) |
| Class I share of industry (AAR) | Roughly 67% of mileage, 87% of employees, 94% of freight revenue |
| Short lines / regionals (AAR) | About 615 Class II and III freights |
| Industry employment (AAR, recent) | About 153,000 direct rail jobs; far larger total economic impact |
| Class I pay package (AAR range) | Average annual wages + benefits often cited from about $135,000 into the high $100,000s (varies by year and source) |
| Fuel efficiency (industry messaging) | On the order of one ton of freight moved hundreds of miles per gallon of fuel—confirm current AAR fact sheets for the exact figure you cite publicly |
Industry statistics change year to year. Prefer primary AAR and STB releases when you need a single official number. Figures above compiled August 9, 2026 from public STB and AAR materials.
Definition and Revenue Thresholds
While the dollar figure that defines a Class I has changed repeatedly, the idea has not: a Class I is a railroad in the top revenue tier under federal classification rules. Today that classification is set by the Surface Transportation Board under 49 C.F.R. Part 1201, not by informal industry usage alone.
For regulatory purposes the STB groups carriers as Class I, II, or III by annual operating revenue. Thresholds are expressed in nominal dollars but adjusted for inflation from a published base year using a railroad revenue deflator. In a major reset effective for reporting years after the Board’s 2021 rulemaking, the Class I floor was raised from $250 million (1991 dollars) to $900 million (2019 dollars), with Class II adjusted upward as well. Annual deflator factors then convert those bases into current-year dollars.
For 2025 (the most recent year for which the Board has published deflator factors as of this revision), the STB lists approximately:
- Class I: $1,094,774,354 or more in annual operating revenue
- Class II: $49,143,204 or more (and below Class I)
- Class III: below the Class II floor
Source: STB Economic Data (Revenue Deflators). Always re-check the Board’s current EP 748 / deflator publication before citing a threshold in formal work.
Trade usage sometimes still quotes the $900 million (2019 dollars) base or older ladders. For American-Rails.com purposes, treat the STB inflation-adjusted figure for the year in question as authoritative, and note the base-year change so older books and articles do not confuse readers.
How the threshold evolved (selected milestones)
| Period / year | Approximate Class I floor (as commonly cited) |
|---|---|
| 1939 | $1 million annual operating revenue |
| 1956 | $3 million |
| 1965 | $5 million |
| 1976 | $10 million |
| 1978 | $50 million |
| 1992 / 1993 era | $250 million (1991 dollars)—long-standing ICC/STB base |
| 2010s–2019 (examples) | Inflation-adjusted figures such as ~$319M (2005), ~$476M (2014), ~$505M (2019) |
| Post-2021 rule (base) | $900 million in 2019 dollars |
| 2025 (STB published) | About $1.095 billion |
During the industry’s classic era, a Class I could be only a few hundred miles long if it met the revenue test. Small names such as the Detroit & Mackinac, Lehigh & Hudson River, Green Bay & Western, and Spokane International once wore the label. Today no freighter shorter than a multi-thousand-mile continental system sits in the Class I club; CPKC is the smallest of the six by route miles among the North American giants, but still far larger than any regional.
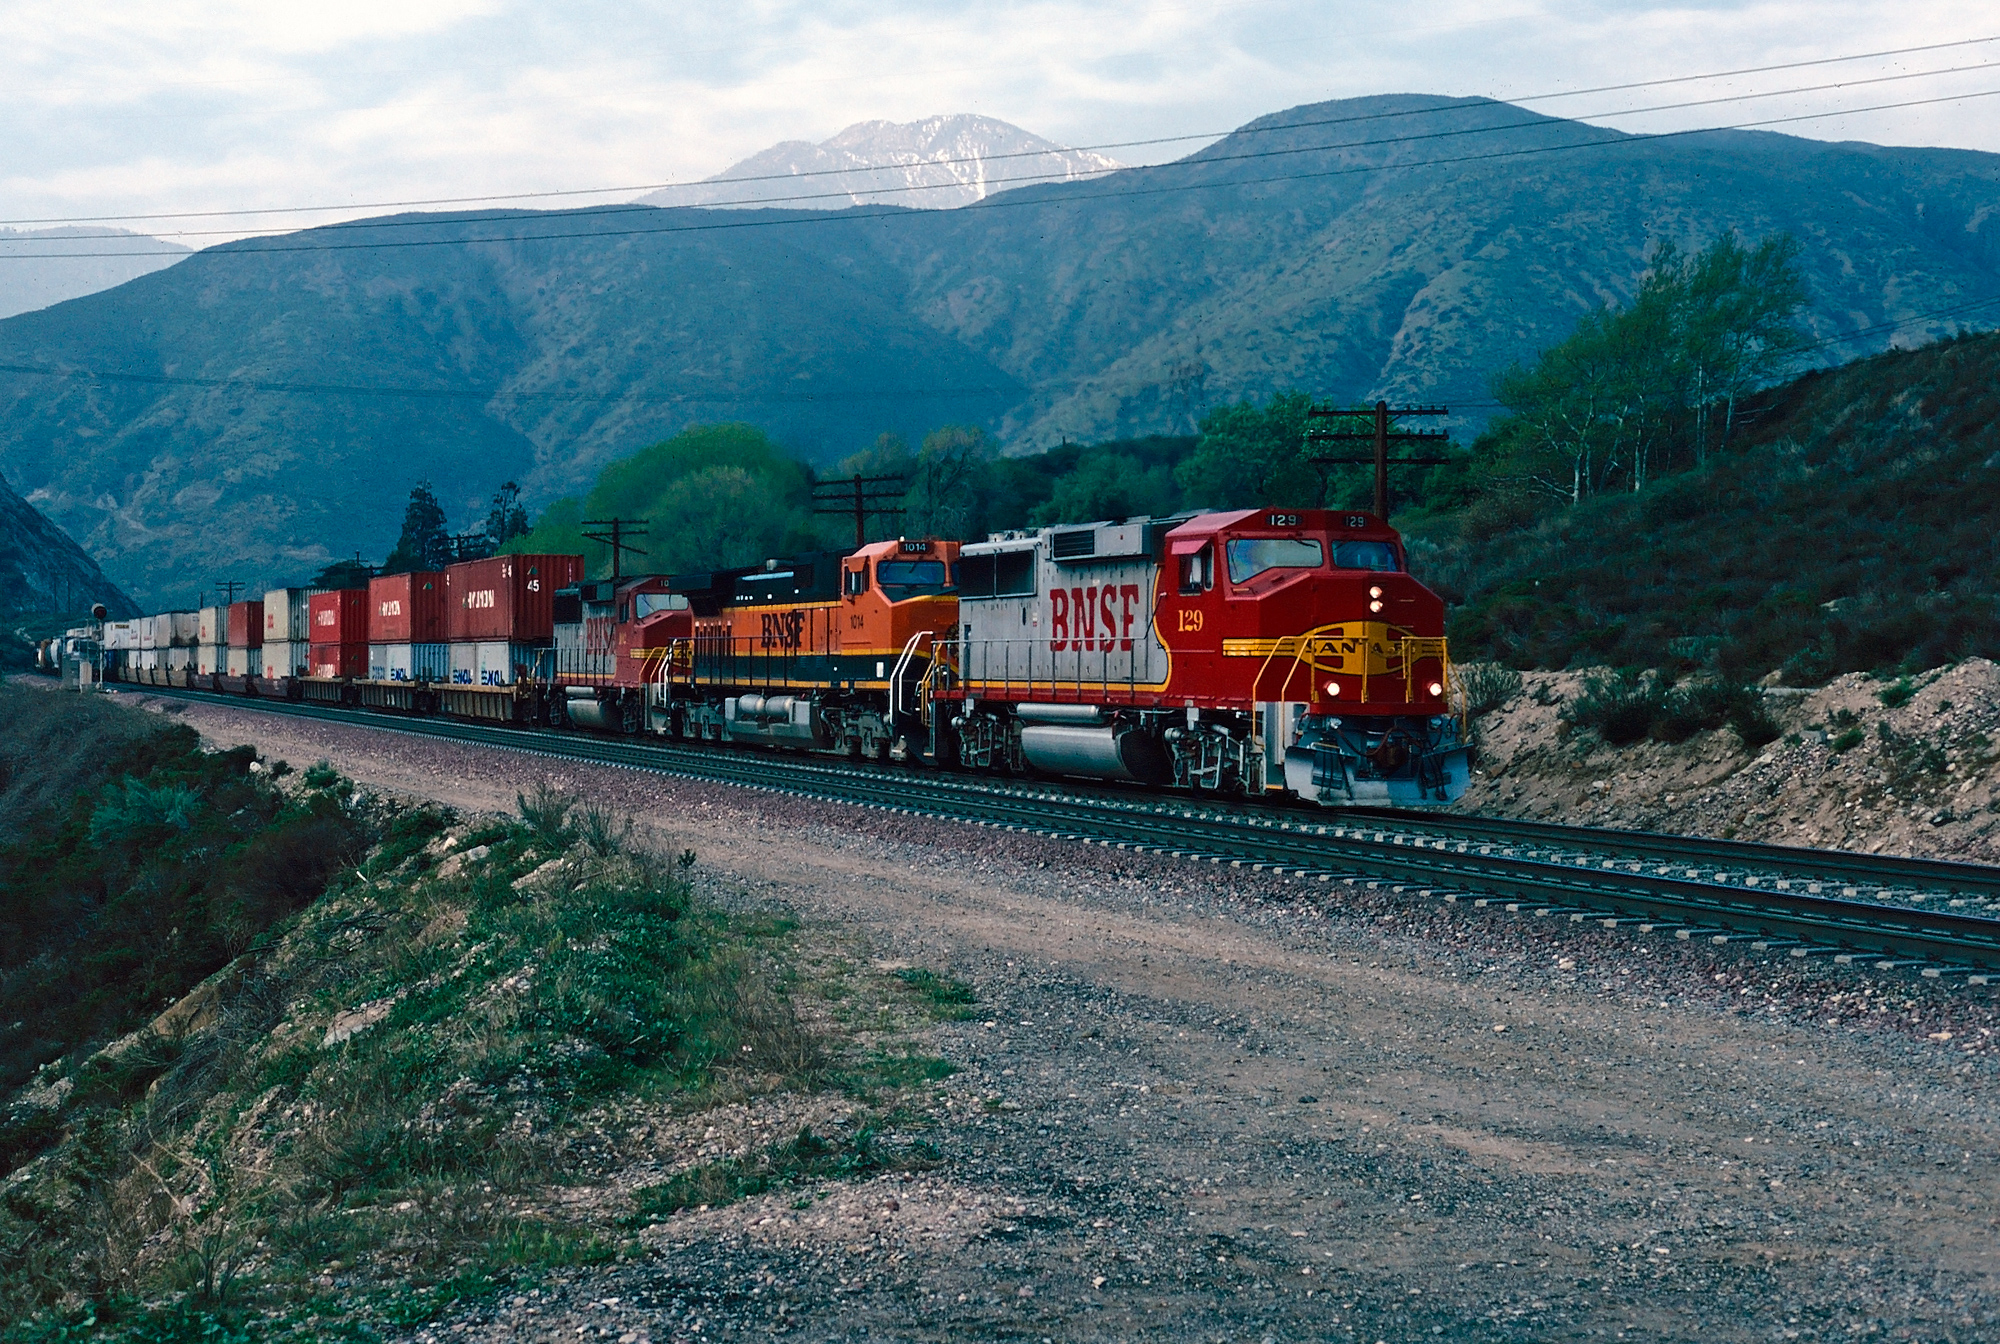
It’s the early Burlington Northern Santa Fe era as a pair of former Santa Fe GP60M’s, led by #129, along with BNSF C44-9W (#1014), work an eastbound up the west side of Cajon Pass at Blue Cut, California in June, 1997. American-Rails.com collection.
History: From Scores of Class Is to Six
Federal regulation, highway and water competition, and the passenger-train crisis pushed railroads toward consolidation. Mergers and abandonments shrank the map from the 1916 peak of about 254,000 route miles to roughly 140,000 today. Class I systems own on the order of two-thirds of that mileage; much of the rest was spun off after the Staggers Rail Act of 1980 to short lines and regionals that now number in the hundreds.
Western duopoly (BNSF and Union Pacific) and eastern duopoly (CSX and Norfolk Southern) define most domestic long-haul freight geography, with the Mississippi River a rough dividing line. Canadian National and CPKC supply critical north–south and cross-border routes, including CN’s mid-continent U.S. network and CPKC’s Canada–U.S.–Mexico single-line franchise.
Canadian Pacific Kansas City (2023)
On March 21, 2021, Canadian Pacific announced it would acquire Kansas City Southern. Rival Canadian National offered a higher bid, but the STB rejected CN’s voting-trust approach on August 31, 2021. CP completed the purchase of KCS into a voting trust on December 14, 2021; after final STB approval on March 15, 2023, CP and KCS combined as Canadian Pacific Kansas City (CPKC) on April 14, 2023—the first single-line railroad linking Canada, the United States, and Mexico under one banner. KCS no longer exists as a separate Class I.
Full profile: Canadian Pacific Kansas City.
Could there ever be a new Class I?
In the modern age it is unlikely a greenfield Class I will appear, though the idea is not impossible. In the 1990s, a growing Wisconsin Central approached the old revenue threshold after rebuilding Soo Line castoffs into a profitable midwestern system; Canadian National purchased WC in 2001. A similar regional growth story today would almost certainly involve acquisition rather than new main-line construction. Extensive environmental review, land-use opposition (“NIMBY”), and capital cost make major new corridors rare—the long-fought Tongue River Railroad coal project in Montana, first proposed in the 1980s, was ultimately rejected by the STB in 2016.
Reviving long-abandoned mains (for example, Milwaukee Road’s Pacific Extension or portions of Erie Lackawanna’s Chicago line) remains a favorite railfan speculation. A few short rebuilds have occurred since the 1990s, and many rights-of-way are railbanked for possible future freight use, but a multi-state Class I-scale reactivation would be extraordinary.
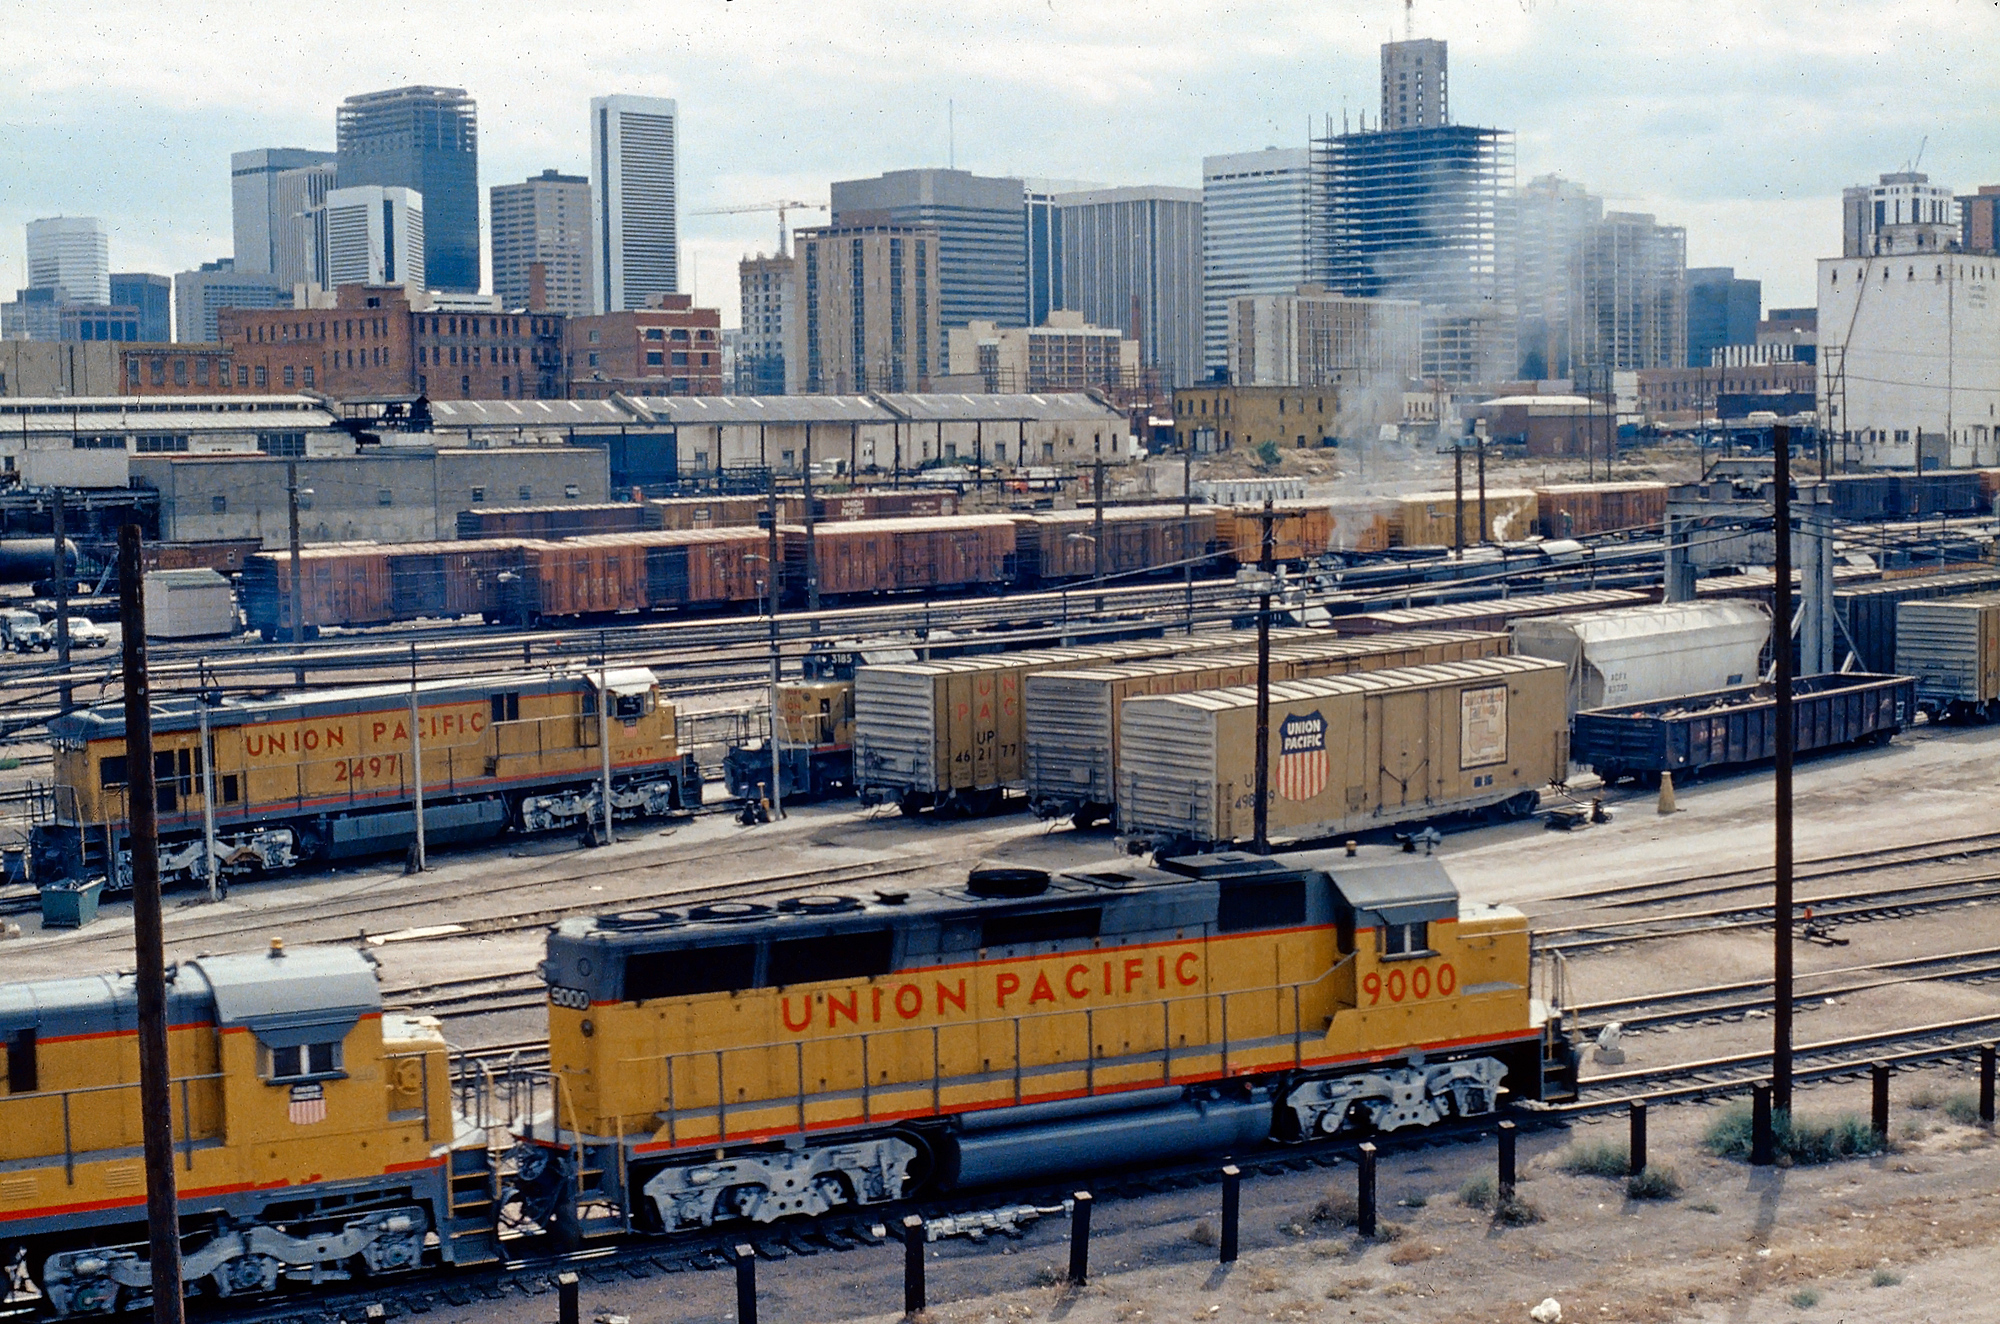
Union Pacific power, including GP40X #9000, along with C30-7 #2497 and SD40-2 #3185, layover at Rio Grande’s Burnham Shops in downtown Denver, Colorado, in the summer of 1982. Barely visible in the background is Union Pacific 4-8-4 #8444, which was hosting excursions from Denver to Sterling. Mike Bledsoe photo. American-Rails.com collection.
Recent Operating Revenues (Tables Replace Older Charts)
Earlier versions of this page used Excel-generated bar charts of Class I annual revenue through about 2022. Those graphics are retired. Company totals below are approximate full-year operating or total revenues as reported by each railroad (or widely reported from those filings). Canadian carriers report primarily in Canadian dollars; USD equivalents move with exchange rates—use company filings for precision.
Always verify the latest 10-K / annual report or investor release before treating any figure as definitive. Compiled August 9, 2026 from public earnings releases and secondary summaries of those releases.
Approximate full-year revenues (selected recent years)
| Railroad | 2023 (approx.) | 2024 (approx.) | 2025 (approx.) | Notes |
|---|---|---|---|---|
| Union Pacific | — | Freight revenue ~$22.8B; total operating revenue in mid-$20B range | Operating revenue about $24.5B | Western Class I; largest or near-largest U.S. freight revenue in recent years |
| BNSF Railway | — | About $23.3–23.4B | About $23.4B (essentially flat y/y in public summaries) | Berkshire Hathaway; private reporting via parent / BNSF financials |
| CSX Transportation | About $14.7B | About $14.5B | About $14.1B | Eastern Class I; coal and mix shifts continue to matter |
| Norfolk Southern | — | Railway operating revenue about $12.1B | About $12.2B | Eastern Class I; 2023 East Palestine event and recovery affect multi-year comparisons |
| Canadian National | About C$16.8B | About C$17.0B | About C$17.3B | Systemwide CAD; U.S. subsidiaries are Class I for STB reporting |
| CPKC | Partial first year as combined system | About C$14.5B total revenues (company reports) | Freight revenues on the order of C$14.8B+; total revenues ~C$15B class (confirm annual report) | Combined CP+KCS from April 14, 2023; Canada–U.S.–Mexico single line |
For sortable multi-year series and official U.S. regulatory data, use:
- STB Annual R-1 / financial data (carrier-level schedules)
- AAR Freight Rail Facts & Figures
- Bureau of Transportation Statistics
Investor / annual report links
- BNSF Railway — Financial Information
- Canadian National — Investors
- CPKC — Investors
- CSX — Investors
- Norfolk Southern — Investors
- Union Pacific — Investors
Current Class I Railroads (Profiles on American-Rails.com)
- BNSF Railway — 1995 merger of Burlington Northern and Atchison, Topeka & Santa Fe; Berkshire Hathaway ownership since late 2009; western duopoly partner to UP
- Union Pacific — Historic western giant; Pacific Coast and Gulf Coast to Midwest and Mexican gateways
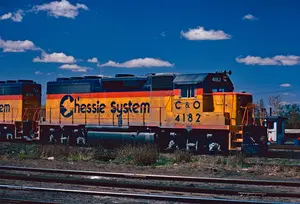
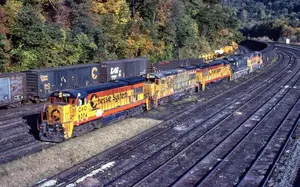
- CSX Transportation — Primary eastern network (former Chessie System / Seaboard System lineage and later additions)
- Norfolk Southern — Primary eastern network (Norfolk & Western / Southern Railway core and later additions)
- Canadian National — Canada-based system with extensive U.S. routes via former Illinois Central, Wisconsin Central, Grand Trunk, and related properties
- Canadian Pacific Kansas City — CP + KCS (2023); first single-line Canada–U.S.–Mexico Class I network
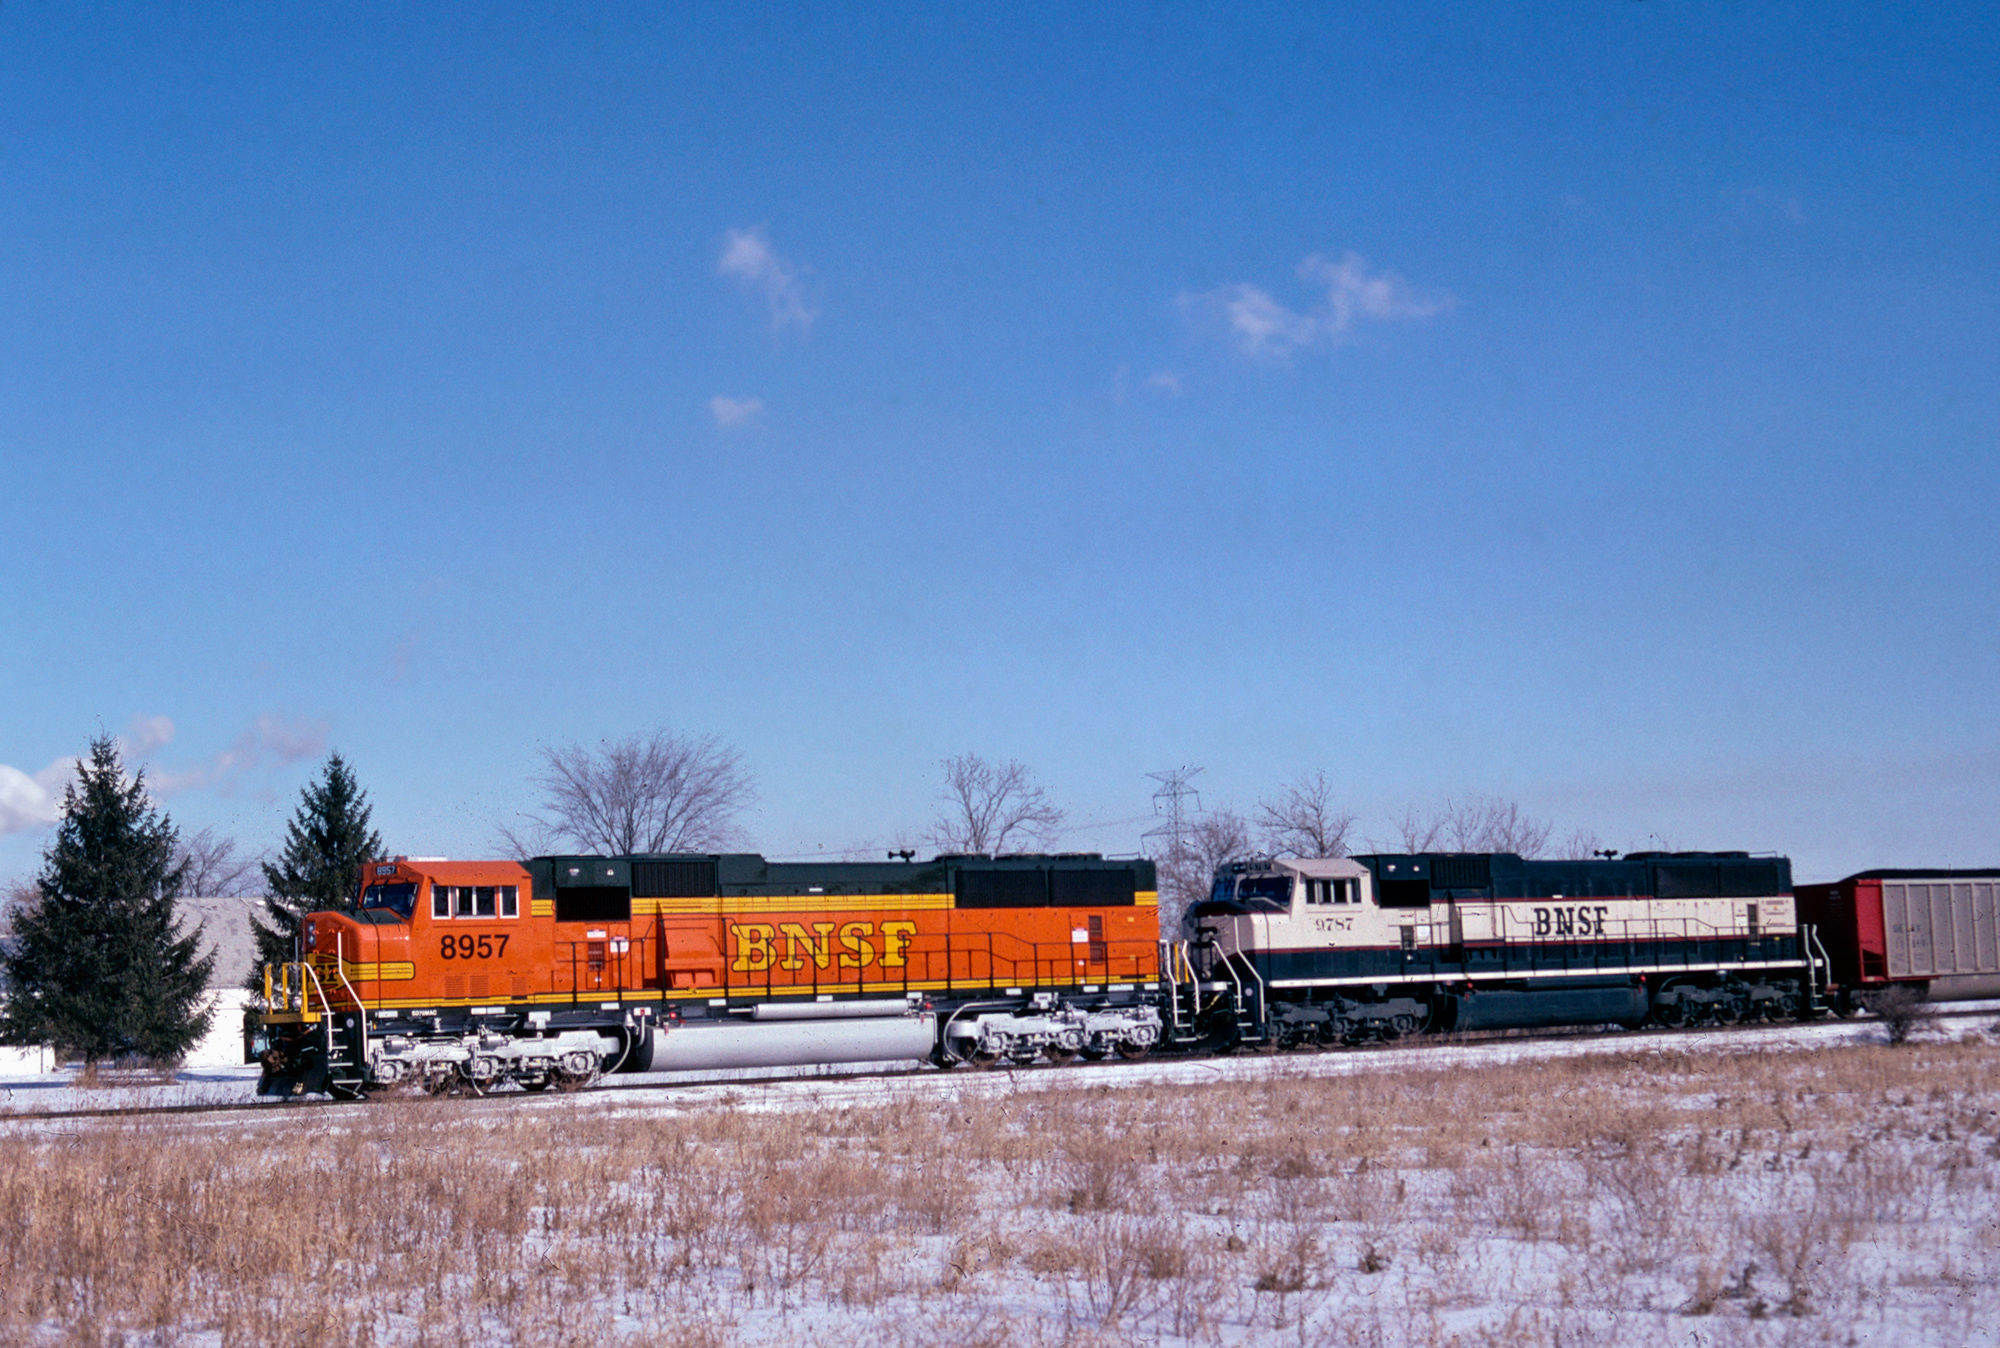
Burlington Northern Santa Fe SD70MAC #8957, wearing the “Heritage II” livery, and SD70MAC #9787, sporting the “Executive” scheme, have a cut of loaded coal hoppers at Oregon, Ohio on the Norfolk Southern in March, 2002. American-Rails.com collection.
Merger Watch: Union Pacific and Norfolk Southern (2025–)
In late July 2025, Union Pacific and Norfolk Southern announced an agreement aimed at creating what the companies call America’s first true transcontinental freight railroad. An initial STB application was filed in December 2025; after completeness issues, a revised major merger application was refiled in spring 2026, and the Board’s review process has continued with supplemental filings through mid-2026. As of this revision the merger is not consummated—approval, denial, or conditioned approval remains with the STB.
If approved without structural carve-outs that change the outcome, the industry would likely move from today’s six large freights toward a structure with one coast-to-coast U.S. giant opposite BNSF in the West and a reconfigured East—exactly the sort of map redraw that past CP–NS and CP–CSX proposals only hinted at in the 2010s. Shippers, labor, ports, and competing railroads are active parties; treat all synergy claims and opposition filings as advocacy until the Board rules.
Official docket materials: STB Major Railroad Mergers (UP–NS proceeding).
Earlier CP approaches to Norfolk Southern (2015–2016 under then-CEO E. Hunter Harrison) and informal talk of other eastern pairings remain useful historical context: they show how close the industry has repeatedly come to a two-system North American freight map—and how difficult multi-jurisdictional approval remains.
What Class Is Carry and Why It Matters
Class I freights move the bulk of U.S. rail ton-miles: intermodal containers and trailers, chemicals, grain and agricultural products, coal (still important though reduced from its peak share of rail revenue), automotive, metals, forest products, and aggregates. They interchange with hundreds of short lines that provide first- and last-mile industrial access. Capital intensity is extreme; AAR materials note tens of billions of private capital reinvested over decades into track, bridges, terminals, and locomotives—one reason new entrants struggle to reach Class I scale.
For passenger context (Amtrak and commuter agencies are not Class I freights under the AAR six-railroad freight list), see Amtrak and Commuter Rail.
Related Reading on American-Rails.com
- Regional Railroads (Class II)
- Short Line Railroads (Class III)
- American Railroad History
- Fallen Flags
- Rail Infrastructure
- Railroad Jobs
Revenue thresholds, carrier counts, and merger status change. Confirm STB classification figures and company financials on official sites before relying on any single year’s number. Information compiled August 9, 2026.
Recent Articles


-
Boone & Scenic Valley Wolf Dinner Train (2026)
Sep 19, 26 08:15 PM
 2026 Boone & Scenic Valley Wolf Dinner Train—Des Moines River valley, Bass Point Creek High Bridge, Union Pacific dining cars. Confirm on bsvrr.com.
 -
C&NW 4-6-2s 1617 & 1620: Minnesota 400 Yellow Jackets
Sep 19, 26 11:28 AM
 C&NW Class E Pacifics 1617 and 1620—Alco Schenectady 1917, yellow-and-green E-4-style shrouds 1941 for the Minnesota 400. Crews called them Yellow Jackets. Renumbered 617/620. Scrapped 1956.
 -
Erie Lackawanna Diesel Roster: All-Time
Sep 19, 26 10:13 AM
 Erie Lackawanna diesel—Erie and DL&W inheritance, GP35s, U25Bs, SD45/SDP45/SD45-2, U34CH. All-time roster with serials and orders. Conrail April 1 1976.
 -
Erie Lackawanna Railway: Map, History, Logo
Sep 19, 26 10:06 AM
 Erie Lackawanna Railway—Erie and DL&W, October 17 1960–March 31 1976. Von Willer, White revival, Dereco, Agnes, Conrail. High-and-wide Chicago main. Map, logo, what remains.
 -
"Empire State Express" (1941 Train): Timetables, Route, Consist
Sep 18, 26 10:59 PM
 NYC Empire State Express—George Daniels 1891 day train, 999’s 112.5 mph claim, Budd stainless streamliner December 7 1941, Cleveland and Detroit sections, diesels, 1967 name drop. Timetables, consist…
 -
New York Central 4-6-4s 5426 & 5429: Empire State Express Hudsons
Sep 18, 26 10:32 PM
 NYC J-3a Hudsons 5426 and 5429—Alco 1937, Budd stainless shrouds 1941 for the Empire State Express. Pearl Harbor inaugural. Shrouds off by 1950. Neither preserved.
 -
"Stourbridge Lion" Locomotive: Facts, History, Photos
Sep 18, 26 10:27 PM
 Stourbridge Lion—Foster, Rastrick 0-4-0, first steam locomotive in the United States. Horatio Allen, Honesdale, August 8, 1829. Too heavy for D&H gravity track. Boiler in Baltimore; Colonie replic…
 -
Delaware & Hudson Steam Roster (Post 1900)
Sep 18, 26 10:01 PM
 Delaware & Hudson steam—Camelback 2-8-0s, Loree high-pressure compounds, Class K 4-8-4s, forty Challengers. Post-1900 class roster after Drury. Last steam July 21, 1953.
 -
Boston & Maine Steam Roster (Post 1900)
Sep 18, 26 02:57 PM
 Boston & Maine steam—B-15 Moguls, K-8 Consolidations, P-4 Lima Pacifics, T-1 Limas, R-1 Mountains. Post-1900 class roster after Drury. Last steam July 23, 1956.
 -
Boston & Maine Diesel Roster (All-Time)
Sep 18, 26 01:25 PM
 Boston & Maine diesel—boxcab 1100 1935, Flying Yankee 6000, FTs, E7s, BL2s, GP7/GP9, GP38-2s and GP40-2s. All-time roster. Last steam July 23, 1956.
 -
Mid-Continent Railway Museum Dining (2026)
Sep 18, 26 01:21 PM
 2026 Mid-Continent dining in North Freedom—select-date seated meals in luxury cars, reservations required. Pizza Limited June 28. Confirm on midcontinent.org.
 -
Bessemer & Lake Erie Steam Roster (Post 1900)
Sep 18, 26 12:11 PM
 Bessemer & Lake Erie steam—C3A 150–151, D1A/D2A Santa Fes, 47 H1 Texas types after Burlington. Post-1900 class roster after Drury. Last steam 2-8-0 156, May 14, 1953.
 -
Bessemer & Lake Erie Diesel Roster (All Time)
Sep 18, 26 12:09 PM
 Bessemer & Lake Erie diesel—Westinghouse 281 1936, Baldwin DRS-6-6-1500s, F7s 1950–53, SD7/SD9/SD18/SD38 family, RSD-15s. All-time roster. Last steam 2-8-0 156, May 14, 1953.
 -
Bangor & Aroostook Steam Roster (Post 1900)
Sep 18, 26 11:21 AM
 Bangor & Aroostook steam—Manchester Ten-Wheelers, Alco Mountains 100–109, G-2 Consolidations, Pacifics 250–254. Post-1900 class roster after Drury. Last steam Pacific 251, July 22, 1951.
 -
Bangor & Aroostook Diesel Roster (All Time)
Sep 18, 26 11:09 AM
 Bangor & Aroostook diesel—F3s 1947, eight BL2s, E7s, GP7s leased to the PRR, GP9s, GP38s. All-time roster. Last regular steam July 22, 1951.
 -
B&O Steam Locomotive Roster (Post 1900)
Sep 18, 26 10:33 AM
 Baltimore & Ohio steam—Old Maude, E-27 Consolidations, Q Mikados, Big Sixes, EM-1 Yellowstones, President Pacifics. Post-1900 class roster after Drury. Last public steam May 17, 1958.
 -
Baltimore & Ohio (B&O): Diesel Roster (All-Time)
Sep 18, 26 10:28 AM
 Baltimore & Ohio diesel—boxcab 1925, EMC 50 1935, EA 1937, FTs, F3s, F7s, FA-2s, sharks, GP7/GP9, GP30s after C&O 1963, SD50s 8576–8595 1984. All-time roster. Last steam 1958.
 -
Detroit & Toledo Shore Line Railroad: Map, Roster, History
Sep 18, 26 12:32 AM
 Detroit & Toledo Shore Line—Pleasant Bay 1898, named 1899, Detroit–Toledo freight bridge, GTW and Clover Leaf/NKP/N&W. Merged into Grand Trunk Western June 26, 1981.
 -
Lackawanna Steam Locomotives: History, Roster & Photos
Sep 18, 26 12:17 AM
 Delaware, Lackawanna & Western steam—Camelback 2-8-0s, Mikados, freight Pacifics, Poconos 4-8-4s, Hudsons. Post-1900 roster after Drury. Last steam July 13, 1953.
 -
Lackawanna (DL&W) Diesel Roster: All Time
Sep 18, 26 12:11 AM
Delaware, Lackawanna & Western diesel—boxcabs 1926, EMC SC 425–426 1935, FTs 1945, F3/F7/E8, GP7s, RS-3s, FM Train Masters. All-time roster. Last steam 1953. -
Lackawanna Railroad: Map, History, Viaducts, Rosters
Sep 18, 26 12:04 AM
 TDelaware, Lackawanna & Western—Liggett’s Gap 1832, named March 11 1853, Hoboken–Buffalo, anthracite, Phoebe Snow, Cutoff and Tunkhannock. It merged with the Erie to form Erie Lackawanna on Octobe…
 -
Rail News, The Latest
Sep 17, 26 11:56 PM
This page provides a portal to the latest in rail news, from preservation and restortation subjects to other notable topics. -
Union Pacific Big Boy 4014 Sets First Holiday Tour for Make-A-Wish
Sep 17, 26 11:54 PM
 Union Pacific Big Boy 4014’s first holiday tour: Cheyenne–Denver tickets, Nov. 21 Denver-area display, Make-A-Wish. Museum patrons Oct. 16; public Oct. 19.
 -
Conrail Diesel Roster (All Time)
Sep 17, 26 10:27 PM
Conrail diesel—~5,000 inherited 1976, Big Blue, GP15-1s, SD40-2s, SD50s, Dash-8s, SD60/60M/60I, SD80MACs. All-time CR-number roster. -
Chessie System (Railroad): The C&O, B&O, And WM
Sep 17, 26 09:38 PM
 Chessie System, Inc.—C&O, B&O, and Western Maryland. Kitten-C paint 1972, holding company February 26 1973, CSX November 1 1980, C&O into CSXT August 31 1987.
 -
Chesapeake & Ohio (C&O) Diesel Roster: All-Time
Sep 17, 26 06:01 PM
 Chesapeake & Ohio diesel—late steam, no Fairbanks-Morse, E7s 1946, GP7/GP9 flood, F7s, GP40-2s, B30-7s, SD50s 1984–85. All-time roster. Steam ended 1956.
 -
Chesapeake & Ohio (C&O) Steam Roster: Post-1900
Sep 17, 26 03:18 PM
 Chesapeake & Ohio steam—H-8 Alleghenies, K-4 Kanawhas, T-1 Texas, Greenbriers, H-6 1949 Mallets. Post-1900 class roster including Pere Marquette and Hocking Valley. Last steam 1956.
 -
Chesapeake and Ohio Railway: Map, Logo, History
Sep 17, 26 02:36 PM
 Chesapeake & Ohio Railway—Louisa Railroad 1836, named August 31 1868, Ohio River 1873. Coal, Chessie the kitten, Pere Marquette 1947, B&O control 1963, into CSX August 31 1987. Complete corporate…
 -
TVRM Valentine Train Ride (2026)
Sep 17, 26 02:31 PM
 2026 TVRM Valentine Train Ride in Chattanooga—Feb. 6–15, plated dinner, Grand Junction Depot. Confirm on tvrail.com.
 -
River Fox Train Dining (2026)
Sep 17, 26 02:29 PM
 2026 River Fox Train in West Sacramento—Brunch Train and Murder Mystery dinner. 18095 County Road 117. Confirm on riverfoxtrain.com.
 -
Weehawken Terminal, Serving The West Shore Railroad
Sep 17, 26 01:38 PM
 Weehawken Terminal—West Shore / New York Central Hudson waterfront station, opened 1884. Five ferry slips, sixteen tracks, Weehawken Tunnel 4,014 feet. Last ferry March 25, 1959. Port Imperial and HBL…
 -
West Shore Railroad: Map, History, Timetables
Sep 17, 26 01:32 PM
 West Shore Railroad—New York, West Shore & Buffalo 1880–83, Weehawken to Buffalo. PRR-backed rival to the Central. Morgan settlement, 475-year NYC lease January 1 1886. CSX River Sub today.
 -
Jersey Central Diesel Locomotives: History, Roster & Photos
Sep 17, 26 01:20 PM
 Central Railroad of New Jersey diesel—boxcab 1000, Baldwin double-enders, F3s, Train Masters, SD35s, GP40Ps. All-time roster. Steam ended July 1, 1954.
 -
Jersey Central Steam Locomotives: History, Roster & Photos
Sep 17, 26 01:17 PM
 Central Railroad of New Jersey steam—Camelback Ten-Wheelers, USRA Mikados, G-class Pacifics, suburban tanks. Post-1900 class roster after Drury. Dieselized July 1, 1954.
 -
Jersey Central Railroad (CNJ): Map, Rosters, History
Sep 17, 26 01:14 PM
 Central Railroad of New Jersey—Elizabethtown & Somerville 1831, named April 23 1849. Communipaw, anthracite, Blue Comet, Reading/B&O control. Conrail April 1 1976. Complete corporate history.
 -
Central Vermont Diesel Locomotives: History, Roster & Photos
Sep 17, 26 11:35 AM
 Central Vermont diesel—Alco S-2s 1942, RS-3s, RS-11s from DW&P, EMD GP9s 1956–57, GP38ACs 1971. All-time roster. Last steam April 4, 1957.
 -
Central Vermont Steam Locomotives: History, Roster & Photos
Sep 17, 26 11:19 AM
 Central Vermont steam—ten Alco 2-10-4s of 1928, four U-1-a Mountains, Consolidations. Post-1900 class roster after Drury. Last steam April 4, 1957.
 -
Central Vermont Railway: Map, Logo, Rosters
Sep 17, 26 11:03 AM
 Central Vermont Railway—Vermont Central charter October 1843, Bethel–White River Junction June 26, 1848. Grand Trunk 1898, CN 1923, RailTex/NECR 1995. Complete corporate history.
 -
Fitchburg Railroad: Map, History, Timetables
Sep 17, 26 10:40 AM
 Fitchburg Railroad—chartered March 3, 1842, Boston–Fitchburg March 5, 1845. Alvah Crocker, Hoosac west door, Vermont & Massachusetts, Cheshire. B&M 99-year lease July 1, 1900. Complete corpora…
 -
Steam Railroading Institute Dining (2026)
Sep 17, 26 10:30 AM
 2026 SRI Owosso dining—vintage dining cars, select evenings. 2026 dinner calendar not posted; 2025 Up In Smoke is the recent example. Confirm on michigansteamtrain.com.
 -
Canadian Pacific Railway: Map, History, Logo, Photos
Sep 17, 26 12:06 AM
 Canadian Pacific Railway—incorporated February 16, 1881. Last spike Craigellachie November 7, 1885. Soo, Milwaukee, D&H, DM&E. CPKC April 14, 2023. Complete corporate history.
 -
Canadian Pacific Diesel Locomotives: History, Roster & Photos
Sep 17, 26 12:03 AM
 Canadian Pacific diesel—E8A 1800 in 1949, FP7/FP9, FA-2, C424, SD40-2, SD40-2F Red Barns, AC4400CW, ES44AC, SD30C-ECO, SD70ACu heritage. All-time roster. Last steam November 6, 1960.
 -
Canadian Pacific Steam Locomotives: History, Roster & Photos
Sep 16, 26 11:35 PM
 Canadian Pacific steam—3,257 engines 1881–1949. D10 Ten-Wheelers, G3 Pacifics, Royal Hudsons, Selkirk 2-10-4s. Post-1900 class roster after Drury. Last steam November 6, 1960.
 -
Woodstown Central Dining in Motion (2026)
Sep 16, 26 11:31 PM
 2026 Woodstown Central Dining in Motion—Salem County table car, 50–60 minutes, private table of four from $190. Confirm on woodstowncentral.com.
 -
NCTM Wine & Dine on the Rails (2026)
Sep 16, 26 11:28 PM
 2026 NCTM Wine & Dine on the Rails in Spencer—Feb. 13–15, three-course dinner, 21+, $145/$140. Sold out. Confirm next season on nctransportationmuseum.org.
 -
Southern Railway 4-6-2 1380: The Streamlined Ps-4
Sep 16, 26 10:34 PM
 Southern Railway Ps-4 4-6-2 1380—Alco 1923, serial 64857. Otto Kuhler streamlining at Spencer 1940–41 for the Tennessean. Only streamlined steam locomotive on the Southern. Scrapped Baltimore 1953.
 -
Texas Mexican Railway: Serving The Border Since The 1880s
Sep 16, 26 09:58 PM
 Texas Mexican Railway—Corpus Christi, San Diego & Rio Grande March 1875, 3-foot. Tex-Mex June 1881, Laredo Sept 1881, Rio Grande bridge 1883. Standard gauge July 17 1902. Mexican government 1900–1…
 -
Mount Hood Railroad Dining (2026): No Plated Dinner Train This Season
Sep 16, 26 09:53 PM
 2026 Mount Hood Railroad in Hood River is scenic Fruit Loop trains with snacks and sandwiches—not a plated dinner train. Confirm on mthoodrr.com.
 -
Peoria and Eastern Railway: Map, Timetables, History
Sep 16, 26 09:39 PM
 Peoria & Eastern—Danville, Urbana, Bloomington & Pekin 1866, IB&W 1869, OI&W 1887. Incorporated Feb 21 1890, Big Four next day. NYC 1930, Conrail 1976. GP7s 5612–5625. Complete corporate history.
 -
Boston and Maine Railroad: "Route Of The Minute Man"
Sep 16, 26 11:30 AM
 Boston & Maine—Andover & Wilmington 1833, NH charter June 27 1835. Eastern, Boston & Lowell, Fitchburg/Hoosac, Concord & Montreal. Section 77 March 12 1970. Guilford June 30 1983. CSX June 1 2…