U.S. Rail Traffic Surges 8.7% in Holiday Week Ending July 4, 2026
Published: July 10, 2026
By: Adam Burns
Strong Intermodal Growth and Broad Commodity Gains Offset Coal Weakness; Year-to-Date Volumes Remain Solidly Positive
The Association of American Railroads (AAR) released its weekly rail traffic report on July 8, 2026, covering the week ending July 4. Despite the Independence Day holiday (which fell on a Saturday), U.S. freight railroads delivered an impressive performance, posting an 8.7% year-over-year increase in total traffic. The results underscore continued strength in intermodal volumes and broad-based gains across most carload commodity groups, even as coal traffic continued its structural decline.
Total U.S. weekly rail traffic reached 482,121 carloads and intermodal units, up 8.7% from the same week in 2025. This was a solid showing for a holiday-shortened week, when many shippers and some railroad operations traditionally scale back activity around the July 4th weekend.
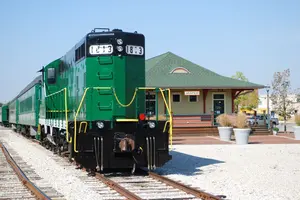
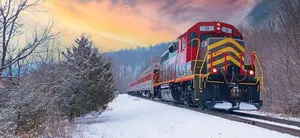
 Livonia Avon & Lakeville C430 #433, C424 #426, and C425 #425 come around the curve in Henrietta, New York alongside CSX's West Shore line on November 20, 2025. Doug Kroll photo.
Key Weekly Highlights
U.S. Traffic Breakdown (Week Ending July 4, 2026)
U.S. Rail Traffic Summary
Week Ending July 4, 2026 — Source: Association of American Railroads
| Metric | This Week | YoY Change |
|---|---|---|
| Total Traffic | 482,121 | +8.7% |
| Carloads | 212,691 | +3.7% |
| Intermodal Units | 269,430 | +12.9% |
Intermodal volume was the clear standout, rising 12.9% year-over-year to 269,430 containers and trailers. This continues a multi-month pattern of robust double-digit intermodal growth that has been a major bright spot for the Class I railroads. Carloads, while more modest at +3.7%, still represented a healthy gain given the holiday timing and the drag from coal.
Commodity Group Performance
Nine of the ten carload commodity groups posted year-over-year increases. The AAR highlighted three of the strongest absolute gainers:
- Grain: 21,622 carloads (+2,490 carloads / +13.0%)
- Metallic Ores and Metals: 22,262 carloads (+2,134 carloads / +10.6%)
- Farm Products excl. Grain, and Food: 17,346 carloads (+1,961 carloads / +12.7%)
These gains in agricultural and industrial commodities point to solid underlying demand in the broader economy and healthy export markets for grain and metals. Other groups that contributed positively included nonmetallic minerals, chemicals, motor vehicles & parts, forest products, petroleum products, and miscellaneous carloads.
The sole decliner was coal, which fell 4,197 carloads (−7.9%) to 48,841 carloads. Coal remains the largest single carload commodity by volume, but it continues to face long-term structural headwinds from the ongoing transition in the U.S. power generation mix, competition from natural gas, and environmental regulations. Even in weeks when electricity demand is seasonally elevated, coal loadings have struggled to post consistent growth in 2026.
U.S. Carloads by Commodity Group – Week Ending July 4, 2026
U.S. Carloads by Commodity Group
Week Ending July 4, 2026 — Source: Association of American Railroads
| Commodity Group | Carloads | Notes |
|---|---|---|
| Coal | 48,841 | Only decline (−7.9%) |
| Chemicals | 31,608 | Solid contributor |
| Nonmetallic Minerals | 29,533 | Strong industrial demand |
| Metallic Ores and Metals | 22,262 | +10.6% YoY |
| Grain | 21,622 | +13.0% YoY |
| Farm Products excl. Grain & Food | 17,346 | +12.7% YoY |
| Motor Vehicles and Parts | 12,620 | Positive |
| Petroleum & Petroleum Products | 10,960 | Positive |
| Other / Miscellaneous | 9,474 | Positive |
| Forest Products | 8,425 | Positive |
| Total Carloads | 212,691 | +3.7% YoY |
Year-to-Date Performance (First 26 Weeks of 2026)
Looking beyond the single holiday week, the first half of 2026 has been constructive for U.S. freight rail:
- Carloads: 5,894,302 (+3.2% vs. 2025)
- Intermodal units: 7,254,412 (+3.6% vs. 2025)
- Total combined U.S. traffic: 13,148,714 carloads and intermodal units (+3.4%)
The consistent positive year-to-date growth in both carloads and intermodal is encouraging. Intermodal has been the primary growth engine throughout 2026, while carload volumes have shown resilience despite the persistent weakness in coal. Gains in grain, chemicals, nonmetallic minerals, and metals have helped offset the coal drag.
North American Overview
Across the nine reporting U.S., Canadian, and Mexican railroads, total North American rail traffic for the week reached 671,340 carloads and intermodal units, up 8.4% year-over-year.
Breakdown:
Canada
- Carloads: 316,737 (+6.3%)
- Intermodal: 354,603 (+10.3%)
Canadian railroads reported 88,601 carloads (+8.1%) but saw intermodal slip 4.1% to 70,562 units. Cumulative Canadian volume for the first 26 weeks stood at 4,277,145 carloads, containers, and trailers, up a modest 0.6%.
Mexico
Mexican railroads continued their strong 2026 performance, posting 15,445 carloads (+42.2%) and 14,611 intermodal units (+56.0%). Year-to-date Mexican volume reached 673,753 carloads and intermodal units, up an impressive 9.2%. The surge reflects ongoing nearshoring trends, industrial expansion in northern Mexico, and growing cross-border trade with the United States.
Analysis: A Positive Signal Amid Seasonal Noise
The 8.7% jump in a holiday week is noteworthy. Holiday weeks often produce soft absolute volumes and sometimes softer year-over-year comparisons if the prior-year holiday fell differently. That U.S. railroads still managed a strong double-digit intermodal gain and positive carload growth speaks to underlying demand strength.
Positive Takeaways
- Intermodal remains the growth engine of the industry, posting another strong double-digit week. This is a healthy sign for consumer goods, retail inventory replenishment, and overall supply-chain activity.
- Agricultural commodities (grain + farm products/food) showed excellent strength, supporting the view that export demand and domestic processing remain robust.
- Metals and industrial materials continue to perform well, consistent with manufacturing and construction activity.
- Mexico’s explosive growth is a multi-year structural story that benefits U.S. railroads with strong cross-border franchises (especially UP, BNSF, and CPKC).
Challenges / Watch Items
- Coal remains a structural headwind. At roughly 23% of U.S. carloads this week, every percentage-point decline in coal has a meaningful impact on total carload growth. Until the industry fully offsets this with other bulk and industrial traffic, overall carload growth will remain constrained.
- Canadian intermodal softness this week is worth monitoring, though the YTD picture for Canada remains only mildly positive.
- Absolute volumes this week were lower than the preceding non-holiday weeks (as expected), so the sequential trend will be more informative once we get through mid-July.
Overall, the report is net positive. Railroads are benefiting from a still-growing U.S. economy, resilient consumer demand (intermodal), solid agricultural exports, and industrial activity. The holiday week did not interrupt the broader positive trajectory that has characterized the first half of 2026. With the second half of the year typically featuring strong grain harvest movements and continued intermodal seasonality, the industry appears well-positioned for further volume growth—provided the broader economy remains stable and coal does not deteriorate further.
Looking Ahead
The next AAR weekly report (week ending July 11) will be released around July 15–16 and should provide a cleaner post-holiday baseline. Railfans and industry watchers will be watching closely for whether intermodal can sustain double-digit growth and whether grain volumes accelerate into the harvest season. For readers, these weekly numbers remain one of the best real-time barometers of the health of North American freight railroading.
Sources & Notes
Primary source: Association of American Railroads press release and weekly traffic report for the week ending July 4, 2026 (released July 8, 2026). Additional context drawn from AAR social media summaries and historical weekly trends. Absolute commodity figures derived from the detailed traffic PDF. Year-over-year percentage changes for grain, metallic ores & metals, and farm products provided via AAR communications.
Note: The week ending July 4, 2026 included the Independence Day holiday (Saturday). Comparisons are to the corresponding week in 2025. U.S. figures exclude U.S. operations of CPKC, CN, and GMXT as per standard AAR reporting conventions.
Full AAR report: https://www.aar.org/news/aar-reports-weekly-rail-traffic-for-the-week-ending-july-4-2026/
Recent Articles


-
Bessemer & Lake Erie Railroad: "The Bessemer Road"
Sep 15, 26 05:20 PM
 Bessemer & Lake Erie—Bear Creek 1865, Carnegie 1897, U.S. Steel 1901. Ore south from Conneaut, coal north. 2-10-4s, Missabe sister road. CN May 10, 2004. Complete corporate history.
 -
Bangor and Aroostook Railroad: "Serving Northern Maine"
Sep 15, 26 05:05 PM
 Bangor & Aroostook—chartered February 13, 1891, first trains January 1, 1894. Potatoes, paper, Searsport, State of Maine reefers. MM&A 2003, Lac-Mégantic 2013, CP 2020, CPKC today. Complete co…
 -
Baltimore & Ohio Chicago Terminal Railroad: Map and History
Sep 15, 26 03:11 PM
 B&OCT—formed January 6, 1910 to buy Chicago Terminal Transfer. Grand Central, Barr Yard, 78 route-miles. Assigned B&O steam. Complete diesel roster. CSX paper subsidiary, mark BOCT.
 -
The "Alphabet Route" (Railroad): Photos and History
Sep 15, 26 02:53 PM
 Alphabet Route—eight railroads, not one company. P&WV to Connellsville February 11, 1931. Alpha Jets Chicago/St. Louis–New York/Boston. NKP, W&LE, P&WV, WM, Reading, CNJ, L&HR, New Hav…
 -
Milwaukee Road Livestock Operations: Cattle, Dakotas & Montana
Sep 15, 26 02:36 PM
 Milwaukee Road livestock traffic—Dakota and Montana cattle, Iowa hogs, Chicago markets, 28-hour law, head-end stock cars. By 1974 mostly Montana. Rick Burn’s Helena speech. Operations history, not the…
 -
Spirit of Jasper Ride & Dine (2026): Season Pause
Sep 15, 26 02:29 PM
 Spirit of Jasper Ride & Dine in Jasper, Indiana—seated meal on board. Operator: not running public trains for 2026. Depot remains open as a rental. Confirm on spiritofjaspertrain.com.
 -
South Carolina Canal & Rail Road Company: Map and History
Sep 15, 26 01:59 PM
 South Carolina Canal & Rail Road—chartered December 19, 1827. Best Friend of Charleston, 136 miles Charleston–Hamburg October 1833, Aiken inclined plane. South Carolina Railroad 1844, Southern 189…
 -
The Practice of Double-Heading: The Steam Era
Sep 15, 26 01:43 PM
 Doubleheading—two locomotives on the point, each with its own steam crew. Not a rear helper, not diesel MU. How it worked, PRR 1877, mountain grades, and what MU ended.
 -
Mohawk and Hudson Railroad: Map, Pictures, Locomotives
Sep 15, 26 01:20 PM
 Mohawk & Hudson Railroad—New York’s first railroad, chartered April 17, 1826. DeWitt Clinton, inclined planes, Albany & Schenectady 1847, first New York Central May 17, 1853. Complete corporat…
 -
Essex Clipper Dinner Train (2026): Dates, Tickets & What to Expect
Sep 15, 26 01:09 PM
 2026 Essex Clipper Dinner Train in Essex, CT—2.5 hours, four-course meal $129.99, 18+. Fall dates through Oct. 25. Confirm on essexsteamtrain.com.
 -
Camden & Amboy Railroad: Map, History, Photos
Sep 15, 26 12:53 PM
 Camden & Amboy Railroad—chartered February 4, 1830. Joint Companies monopoly with the Delaware & Raritan Canal, John Bull, T-rail. United New Jersey 1872, PRR 999-year lease 1871. Complete corpora…
 -
Cafe Lafayette Dinner Train (2026): Dates, Tickets & What to Expect
Sep 15, 26 12:47 PM
2026 Cafe Lafayette Dinner Train in North Woodstock, NH—2 hours, 20 miles, five-course meal from $125. May–October. Confirm on nhdinnertrain.com. -
Christmas Train Ride Locations (2026): A Complete Guide
Sep 15, 26 10:47 AM
 2026 Christmas train rides by state—Santa, North Pole Express, and holiday trains. Not Polar Express. State guides and product pages. Confirm dates on each railroad.
 -
Baltimore & Ohio Railroad: Linking 13 Great States With The Nation
Sep 15, 26 10:22 AM
 Baltimore & Ohio Railroad—first U.S. common carrier, chartered February 28, 1827. Wheeling 1853, Chicago 1874, C&O control 1963, Chessie 1973, into CSX April 30, 1987. Complete corporate history.
 -
Delaware & Hudson Railway: The Bridge Line
Sep 15, 26 09:59 AM
 Delaware & Hudson Railway—Wurts brothers canal 1823, gravity railroad 1829, Stourbridge Lion, Bridge Line to Montreal. Guilford 1984, CP 1991, NS south line 2015, CPKC north.
 -
Delaware & Hudson Diesel Roster (All-Time)
Sep 15, 26 12:17 AM
 All-time Delaware & Hudson diesel roster—Alco S-2s through C-628s and PA-4s, GE U-boats, Baldwin RF-16s, EMD SD45s and GP38-2/GP39-2s. Serials, dates, dispositions.
 -
Granite Railway, Our Country's First Railroad
Sep 14, 26 11:28 PM
 Granite Railway of Quincy, Massachusetts—chartered March 4, 1826, opened October 7, 1826. Gridley Bryant, 5-foot gauge, horses, Bunker Hill Monument stone. First commercial U.S. railroad.
 -
Milwaukee Road Skytop Lounges: History, Specs & Floor Plans
Sep 14, 26 11:09 PM
 Milwaukee Road Skytop observation cars—Brooks Stevens, 1948. Four Rapids parlor-lounges from Milwaukee Shops, six Creek sleeper-lounges from Pullman-Standard. Floor plans, roster, preservation.
 -
West Virginia Christmas Train Rides (2026): A Complete Guide
Sep 14, 26 11:02 PM
2026 West Virginia Christmas trains—Potomac Eagle North Pole Express in Romney and Christmas at Cass. Not Polar Express. Elkins Polar is not listed for 2026. -
Railroads Of Today: Class I Map, PSR & the 2026 Industry
Sep 14, 26 10:30 PM
 U.S. freight rail in 2026—six Class I railroads on a nearly 140,000-mile network. PSR as everyday practice, how the STB works, traffic mix, short lines and regionals.
 -
Railroad History (USA): Timeline, Facts & How the Network Was Built
Sep 14, 26 10:03 PM
 Full U.S. railroad history hub—origins and inventors, Golden Age peak mileage, Civil War and transcontinental, streamliners, ICC regulation, Penn Central and Conrail, Staggers Act, PSR, and today’s Cl…
 -
Railroads In The 2020s: CPKC, East Palestine & the UP–NS Case
Sep 14, 26 09:51 PM
 U.S. railroads 2020–2026—Class I mileage 91,773 in 2020. COVID traffic drop, CPKC April 14 2023, East Palestine Feb. 3 2023, UP–NS $85 billion case still before the STB.
 -
Railroads In The 2010s: PSR, Coal’s Decline & Positive Train Control
Sep 14, 26 03:51 PM
 U.S. railroads 2010–2020—Class I mileage 95,573 to 91,773. Buffett closed BNSF Feb. 12 2010, Harrison at CP June 29 2012 and CSX 2017, PTC deadline Dec. 31 2018.
 -
Virginia Christmas Train Rides (2026): A Complete Guide
Sep 14, 26 03:46 PM
 2026 Virginia Christmas trains—Virginia Scenic Railway Santa Express from Staunton, about 60 minutes. Confirm dates. Not Polar Express.
 -
MARC Train: Maryland Commuter Rail History, Lines & Roster
Sep 14, 26 01:16 PM
 MARC Train history—Maryland Rail Commuter 1984, B&O and PRR corridors, Penn/Camden/Brunswick lines, Silver Spring 1996, all-time locomotive roster.
 -
Railroads In The 2000s: Merger Freeze, Wisconsin Central & Buffett
Sep 13, 26 07:57 AM
 U.S. railroads 2000–2010—Class I mileage 99,250 to 95,573. STB merger freeze March 17 2000, CN–WC Oct. 9 2001, BNSF Railway Jan. 24 2005, Buffett Nov. 3 2009.
 -
Railroads In The 1990s: Mega-Mergers, Conrail’s Split & the STB
Sep 13, 26 12:13 AM
 U.S. railroads 1990–2000—Class I mileage 119,758 to 99,250. BNSF Sept. 22 1995, UP–SP Sept. 11 1996, Conrail split June 1 1999, ICC Termination Dec. 29 1995.
 -
Railroads In The 1980s: Staggers, Mega-Mergers & Conrail’s IPO
Sep 12, 26 11:12 PM
 U.S. railroads 1980–1990—Class I mileage 164,822 to 119,758. Staggers Oct. 14 1980, CSX and Norfolk Southern, UP–Missouri Pacific–Western Pacific, Conrail IPO March 26 1987.
 -
Wabash Class O-1 4-8-4s: History, Roster & Specifications
Sep 12, 26 11:01 PM
 Wabash Class O-1 4-8-4s—Baldwin 1930–31, twenty-five engines 2900–2924. Fast freight, complete roster, specifications. None preserved.
 -
Staggers Rail Act of 1980: Statute, Contract Rates & the ICC
Sep 10, 26 11:23 PM
 Staggers Rail Act, Pub. L. 96-448, signed October 14, 1980. Harley Staggers, S.1946, contract rates, 180% variable-cost test, abandonments, short lines.
 -
Rock Island E8A 652: Bicentennial Independence Paint & History
Sep 10, 26 10:42 PM
 Rock Island E8A 652—EMD March 1952, serial 15199. 20th Century Railroad Club Independence bicentennial scheme, Peoria and Quad Cities Rockets, Midland Railway, Manly Junction Museum.
 -
Vermont Christmas Train Rides (2026): A Complete Guide
Sep 10, 26 10:37 PM
2026 Vermont Christmas trains—Okemo Valley Holiday Express from Chester Depot Dec. 19–20. Polar is Burlington Dec. 5–6 only. -
Railroads In The 1970s: Penn Central, Amtrak & Conrail
Sep 10, 26 10:18 AM
 U.S. railroads 1970–1980—196,479 miles at the decade’s start. Penn Central bankruptcy June 21 1970, Amtrak May 1 1971, 3R/4R Acts, Conrail April 1 1976, Rock Island 1975, Milwaukee 1977.
 -
Railroads In The 1960s: Mergers, Passenger Collapse & Penn Central
Sep 10, 26 10:03 AM
 U.S. railroads 1960–1970—207,334 to 196,479 miles. Erie Lackawanna 1960, C&O–B&O 1963, N&W–Nickel Plate 1964, SCL 1967, Penn Central Feb. 1 1968.
 -
South Carolina Christmas Train Rides (2026): A Complete Guide
Sep 10, 26 08:36 AM
 2026 South Carolina Christmas trains—South Carolina Railroad Museum Santa Train in Winnsboro. Confirm December dates. Not Polar Express. Drop light-festival padding.
 -
Steam Locomotive Feedwater Heaters: Elesco, Coffin & Worthington
Sep 10, 26 08:29 AM
 Steam locomotive feedwater heaters—open Worthington vs closed Elesco and Coffin. How they work, how to identify them on a smokebox, and why not every engine had one.
 -
Oregon Christmas Train Rides (2026): A Complete Guide
Sep 10, 26 08:22 AM
2026 Oregon Christmas trains—Portland Holiday Express, Garibaldi Candy Cane Express, Sumpter Valley Christmas Trains Dec. 11–13. Polar is Mount Hood. -
Lake Shore & Michigan Southern: Map, History, Timetables
Sep 10, 26 08:12 AM
 Lake Shore & Michigan Southern Railway—Erie & Kalamazoo 1833, Michigan Southern to Chicago 1852, LS&MS April 6 1869, Vanderbilt, Ashtabula 1876, NYC merger Dec. 22 1914. 1910 map and Official Guide.
 -
Big Four Route (CCC&StL): Map, History
Sep 10, 26 12:19 AM
Cleveland, Cincinnati, Chicago & St. Louis Railway—Bee Line 1868, Ingalls’s first Big Four 1880, CCC&StL June 30, 1889, NYC lease Feb. 1, 1930. 1910 and 1930 maps, what still runs. -
Railroads In The 1950s: Diesel, the Interstate & Passenger Collapse
Sep 10, 26 12:15 AM
 U.S. railroads 1950–1960—223,779 to 211,459 miles. Interstate June 29, 1956, dieselization, passenger collapse, TOFC, 1957–58 recession, NYO&W 1957, N&W–Virginian 1959.
 -
New Jersey Christmas Train Rides (2026): A Complete Guide
Sep 10, 26 12:06 AM
 2026 New Jersey Christmas trains—Black River & Western Santa Express from Flemington and Pine Creek Christmas trains in Wall Township. Polar is Whippany and Phillipsburg.
 -
New Mexico Christmas Train Rides (2026): A Complete Guide
Sep 09, 26 11:57 PM
 2026 New Mexico Christmas trains—Cumbres & Toltec Santa’s Holiday Express from Chama Dec. 5–6 (and Antonito, Colo., Dec. 12–13). Coach $25/$15. Not Polar Express.
 -
Grand Trunk Railway: Map, History, Timetables
Sep 09, 26 11:47 PM
 Grand Trunk Railway of Canada—charter Nov. 10, 1852, Montreal–Toronto 1856, Portland, Sarnia, Victoria Bridge, St. Clair Tunnel 1891, Great Western 1882, GTPR, CN Jan. 20, 1923. 1893 map and Official…
 -
Troop Trains In World War II: Sleepers, Kitchen Cars & Movements
Sep 09, 26 11:42 PM
 WWII U.S. troop trains—almost 44 million armed-services passengers, Pullman troop sleepers, ACF kitchen cars, hospital trains, monthly movement tables 1942–45. Not the Military Railway Service. ODT an…
 -
Railroads In The 1940s: War Traffic, Last Steam & the Diesel Flood
Sep 09, 26 11:37 PM
 U.S. railroads 1940–1950—233,670 to 223,779 miles. World War II as the decade’s center, last new steam, diesel flood after V-J Day, 1945 car orders, California Zephyr 1949.
 -
Railroads In World War II: ODT, Record Traffic & Private Operation
Sep 09, 26 03:00 PM
 U.S. railroads in World War II—Lend-Lease freight, Pearl Harbor, Office of Defense Transportation, 1944 peak ~740 billion ton-miles, Dec. 1943–Jan. 1944 seizure. Private operation, not a USRA sequel.
 -
Montana Christmas Train Rides (2026): A Complete Guide
Sep 09, 26 02:54 PM
2026 Montana Christmas trains—Charlie Russell Chew Choo North Pole Adventure from Hanover/Lewistown, Nov. 27–Dec. 19, $71, about 1.5 hours. Not Polar Express. -
Railroads In The 1930s: Depression, Streamliners & the FT
Sep 09, 26 09:32 AM
 U.S. railroads 1930–1940—249,052 to 233,670 miles. Section 77, Eastman, Motor Carrier Act, M-10000 and Pioneer Zephyr 1934, EMC FT 1939. Decade frame, not the streamliner encyclopedia.
 -
Sugar Cane Train (Lahaina): LK&P History, Roster & 2026 End
Sep 09, 26 08:19 AM
 Lahaina, Kaanapali & Pacific Sugar Cane Train—3-foot tourist line 1970–2014. Anaka, Myrtle, 2023 and 2025 fires, September 2026 scrapping. Roster, Hahakea trestle, Pioneer Mill corridor.
 -
Massachusetts Christmas Train Rides (2026): A Complete Guide
Sep 09, 26 08:16 AM
 2026 Massachusetts Christmas trains—Shelburne Falls Moonlight Magic Friday Nov. 27; Edaville Festival of Lights in Carver. Polar is Cape Cod Central in Buzzards Bay.